
Big Data Analytics Utilities: Open Technology (API) Use Case
Forecast MOC Trading Costs for Projected Fund Growth
The Auction Market Impact API is the latest release on Virtu’s Open Technology platform and was created to help you integrate value-add analytics within your in-house processes and workflows. Using your programming language of choice, subscribers can leverage Auction Market Impact to help estimate the cost of trading in the open or closing auctions.
Did you know?
Open Technology subscribers gain exclusive preview access to Auction Market Impact and other endpoints, like our new FX and fixed income market impact models, before they are added to Virtu’s Portal as part of our growing range of analytics products.
HOW TO USE AUCTION MARKET IMPACT
Set up your data request
Use Virtu’s online documentation to easily query Open Technology API endpoints in Java, Python or R languages. Then log into a secure session to initiate the query process*. Next, fill in required payload fields like symbol, symbol type, open or closing auction, date of estimate, and the number of shares to be traded and more. You can run multiple payloads in your session.
Response
Results are rendered to the user environment in the form of a JSON object and can be held in program memory, displayed as a table, converted to a Pandas DataFrame, or even exported as a text file.
Single-Stock Results

Virtu’s team of experts can assist in developing code that works best for the task at hand.
ESTIMATE THE COST OF LARGER ORDER SIZES ASSOCIATED WITH GROWTH IN ASSETS
A common approach to determine how large a fund can grow, before being burdened by excessive transactions costs, is to estimate the cost of trading larger orders where order sizes grow in proportion to a hypothetical increase in assets under management (AUM) (i.e.: a 100% growth in AUM will translate to orders twice as large).
Because the Auction Market Data endpoint accepts entire trade lists, users can submit a representative list of trades at any order size for simulation. For instance, a portfolio manager could gather and submit fund trading activity for a historical period, amplifying order sizes by 25%.
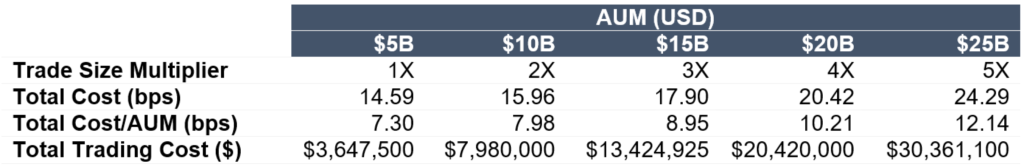
A simple example of a fund at various stages of AUM growth and the associated order size multipliers and hypothetical trading costs.
SUBMITTING A HYPOTHETICAL TRADE LIST TO THE AUCTION MARKET IMPACT ENDPOINT
The next use case query deals with a trade list representing share sizes at some level of AUM.
The resulting cost column in the output is the expected cost (bps) for each trade, which would be aggregated to represent cost of the entire trade list by considering the percentage value (%) executed for each trade. Users preferring Excel may use the SUMPRODUCT function to calculate trade list cost and this can also be performed easily in Python after importing each trade weight: sum(frame[‘%tradedValue’]*frame[‘cost’]).
Note: The query in this use case has been abbreviated for simplicity by removing all but the first and last trade instances for the simulation basket of 500 trades for 4Q 2020.
PUTTING IT ALL TOGETHER
Once total costs are aggregated for your simulated AUM baskets, compiling charts like the ones below can help you understand and communicate expected market-on-close (MOC) costs for various stages of AUM growth, either expressed as dollar trading costs, percentage of value traded, or percentage of AUM.
