Analytics in Action: Open Technology (API) Use Case
Data Mining Historical Blocks for Liquidity Trends
Identify printed blocks and evaluate the block-possibility of stocks using the new Block Volume API.
Block Volume API is the latest release on Virtu’s Open Technology platform, designed to integrate data-driven analytics into your execution processes. Using your preferred programming language, use a simple call to retrieve historical block liquidity and associated bid/ask spreads for a single security or trade lists.
Did you know?
Block Volume identifies blocks by size (minimum 10K shares) and draws from Virtu’s data sources to aggregate block information from different venues. You can set customized thresholds to include block data based on trade size or notional value (e.g.: >25K shares or >US$200K).
Historical block volume information is also available in Virtu’s pre-trade reports run from our Analytics Portal.
HOW TO USE BLOCK VOLUME
Set up your data request
Use Virtu’s online documentation to query Open Technology API endpoints in Java, Python or R languages. Then log into a secure session to initiate the query process. Next, fill in required payload fields like symbol, symbol type, currency and date of estimate. Users can run multiple payloads their sessions, as well as pull results for multiple days.
Response
Results are rendered to the user environment in the form of a JSON object and can be held in program memory, displayed as a table, converted to a Pandas DataFrame, or exported as a text file. Virtu’s team of experts can assist in developing code that works best for the task at hand.

Payload MSFT Results

EXPLORE HISTORICAL BLOCK TRADING PATTERNS AND IDENTIFY CHANGES IN BLOCK POSSIBILITIES FOR A STOCK
The JSON object delivers flexible build metrics that can be customized to account for changes in historical block volume—and can be incorporated in your trade schedule estimates during the pre-trade decision-support phase.
The table shows daily block volume summary statistics for RIC MSFT.OQ from the last week of April 2021. The metric BlockCount depicts the number of block trades executed each day and can be set to alert you if there is a significant uptick in block crossings in the last four days of the month. While the number of block crosses increased over the week in review, the metric AvgBlockSize reveals that the average block trade size was smaller on the last two days of the month compared to previous days.
Historical Block Volume Stats for MSFT.OQ
23-30 April 2021

Daily Block Trading Stats for MSFT.OQ
19 – 30 April 2021

BUILD ANALYTICS TO IDENTIFY BLOCK LIQUIDITY CHARACTERISTICS FOR YOUR TRADE LIST
Extending single-name analysis to trade lists, the JSON object can help you create customized categorical columns to identify whether daily block availability is likely to be low, comparable to, or higher than historical levels. In addition, aggregated statistics such as AvgTradedValue and AvgBlockSize can offer insights on the quality of the blocks being crossed.
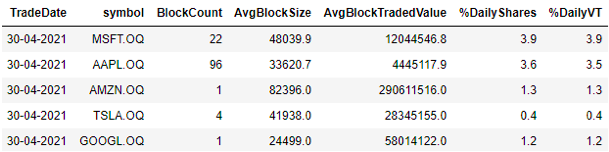
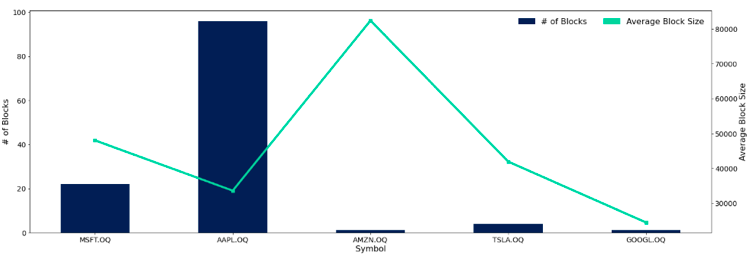
The DailyBlockAvailability column indicates a higher possibility of block trades, based on historical data, for MSFT and AAPL when compared to other large S&P 500 constituents such as AMZN, TSLA and GOOGL on 30 April 2021.
Historical Block Volume Stats for Demo Trade List
30 April 2021

The AvgBlockSize column shows that although the possibility of blocks for MSFT and APPL is higher compared to other names in the list, the historical average block value for these two names is smaller (US$12M and US$4M respectively) on 30 April 2021 when compared to similar names such as AMZN (US$290M and GOOGL (US$58M).
Information on historical block frequency and size can be important when determining an execution strategy for a trade list.
Additional Block Volume Stats for Demo Trade List
30 April 2021

PUTTING IT ALL TOGETHER
Trade list analysis can be expanded to include average bid/ask spread information for blocks crossed, in addition to descriptive information:
Descriptive Block Volume stats for trade list
30 April 2021
Average Bid/Ask Spread for Crossed Blocks by Name
30 April 2021
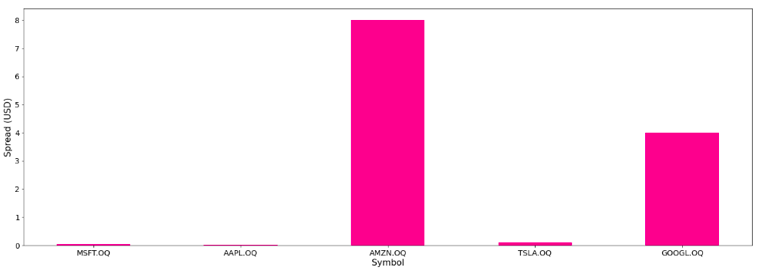
Consistent with higher possibility of blocks, the bid/ask spread for names such as MSFT and AAPL was tighter when compared to less liquid names in the list, such as AMZN and GOOGL.
A trader or portfolio manager could expect to source blocks for MSFT and APPL more readily but under tighter spread conditions.
You can pull market data from end points to compute metrics such as the percentage of total daily volume represented by blocks as well as the percentage of total daily trades represented by blocks.
The %DailyShares metric reveals that block trades represented 3.9% of the daily volume for MSFT and 3.5% of the daily volume for AAPL on 30 April 2021. This is higher than AMZN (1.3% of daily volume), and GOOGL (1.2% of daily volume) on the same day. Also, block possibility for TSLA could be more appropriately classified as low volume because only four blocks were crossed and represented less than 1% of the daily volume.
Selected Block and Daily Volume Stats
30 April 2021